As battery energy storage systems (BESS) rapidly expand to support renewable energy, new data and analysis reveals a concerning trend: while failure rates appear to be improving, the actual risk of fires at individual facilities might be considerably higher than the industry would like to reveal. In fact, developers and industry lobbyists and spokespeople regularly state that fires are “extremely rare.” Let’s examine the validity of that statement.
The industry has been promoting the idea that great strides in safety are being made and that despite a massive growth in deployments, failures have not increased as fast. Improvements certainly have been made. The industry has learned from past mistakes. But the statement that fires are “extremely rare” doesn’t pass muster. EPRI (Electric Power Research Institute), the research arm of the power industry, keeps a database of failures (link). Their own data shows approximately 87 failures since the first utility scale BESS was installed less than thirteen years ago. The majority of these have happened since 2021, about one failure per month. Note, the number has increased since publication to 90 failures).
An important caveat to the EPRI failure data: their database mostly tracks fires that have received media attention so it understates the incidence of fires. Media coverage is an imperfect metric because the media often has other issues to cover that might preclude coverage of a fire, particularly in remote areas. Foreign media may or may or not place an emphasis on these events (and coverage in other languages typically does not always reach the US). So this metric produces an incomplete count of failures.
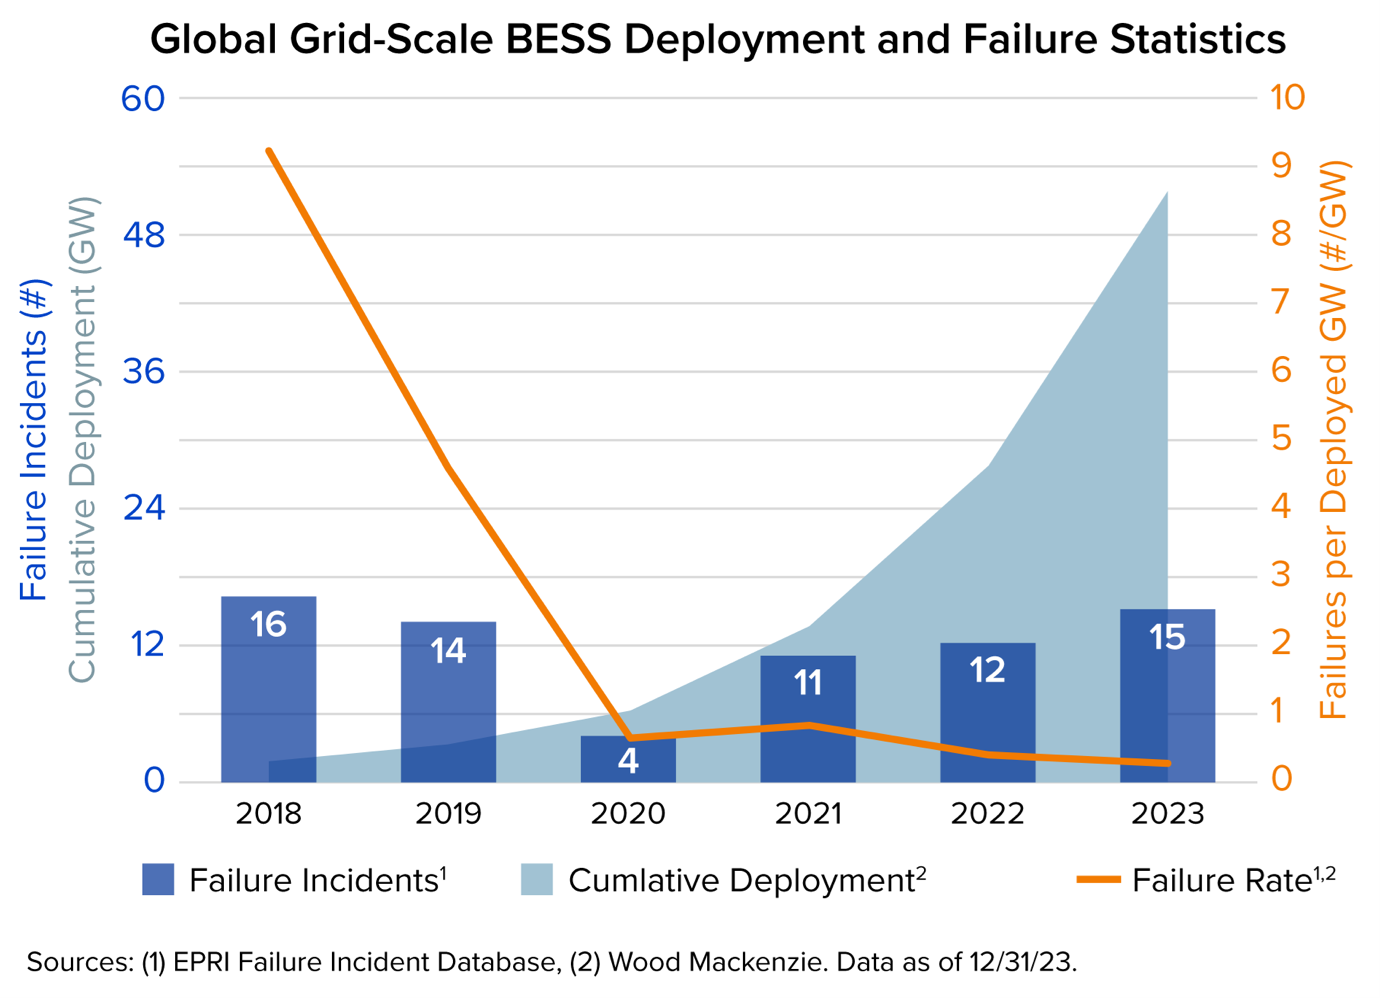
EPRI has been circulating a chart that appears to show that BESS failures have gone down significantly in recent years, despite the explosion in capacity worldwide. We engaged a team of energy experts, researchers and statisticians to review their data and they found that the EPRI chart is misleading for a number of reasons. For one, the chart relies upon media coverage to track failures, so the failure rates it presents are understated.
The light blue curved field indicates cumulative deployed gigawatts (GW). It is a cumulative figure so it counts all the wattage that has been deployed since 2018. In 2023, there were around 52 total gigawatts of BESS facilities deployed worldwide (cumulative deployment, light blue, left axis). The dark blue bars indicate failures in each year. The bars are not cumulative. They show between 4 and 16 failures per year (failure incidents, in dark blue, left axis). And in fact they show that failures have been steadily rising since 2020. Then the chart uses a right axis scale to show failures per GW deployed per year as an orange line. The failures per GW in the early years of 2018 and 2019 were astronomical which makes the more recent data seem small, but is it? Here’s the same chart using just the last four years of data which is when the industry really started to grow exponentially.
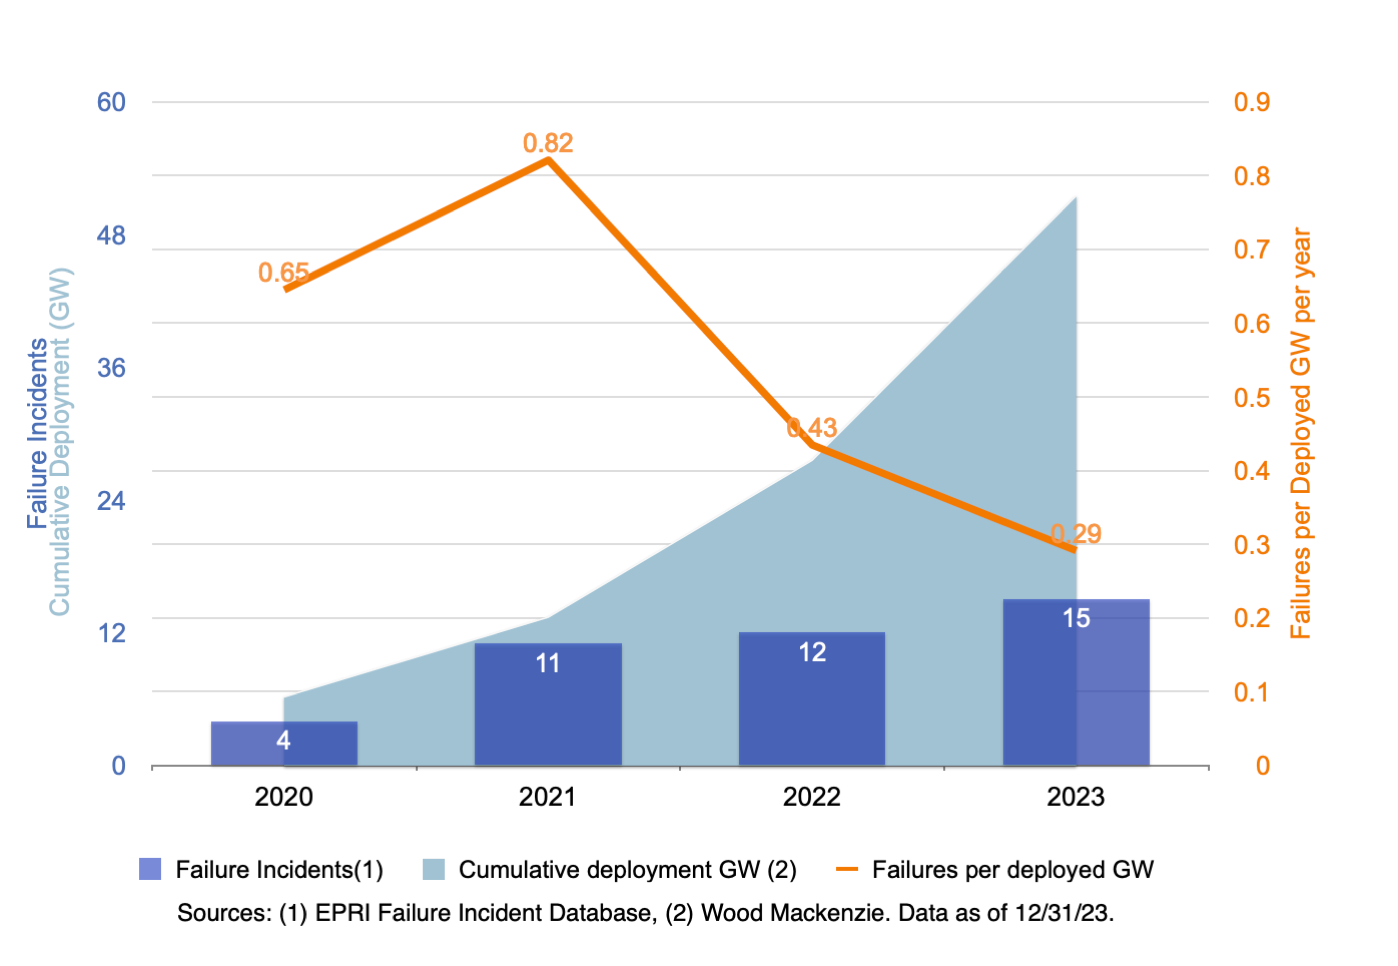
The rescaled chart shows an increase in failure rates (2020-21) followed by some improvement (2021-2023). These up-and-down variations might or might not be statistically significant, given the scant few years of data collected and weakness in the collection methodology. Taken as a whole, however, the risk of failure is still very much a concern. For example, the 2020-23 average is 0.55 failures per GW per year, which means that for every GW deployed, there would be a failure every 2 years or so.
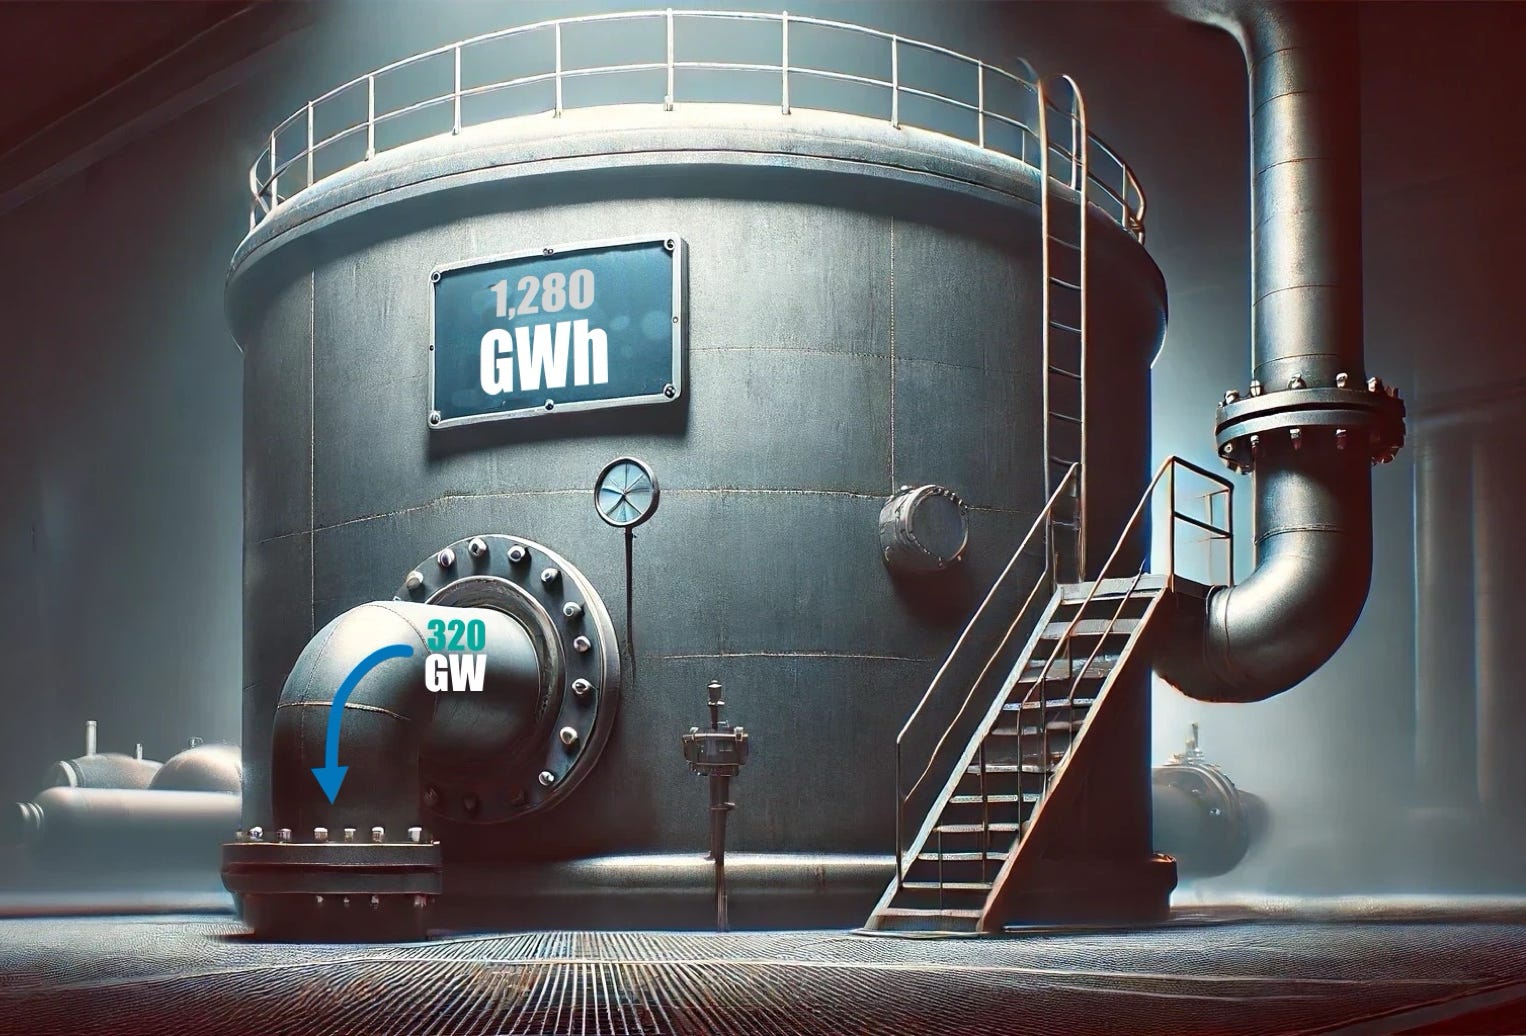
The biggest problem with EPRI’s analysis is that gigawatts are a measure of energy flow, not of storage capacity. To understand how big a facility is (i.e., how much battery material is onsite) you need to know how much energy is stored which is measured in gigawatt-hours (GWh). Using water as an analogy, gigawatts (without hours) measure the flow rate of water coming out of a pipe. But it is gigawatt-hours that tells us the size of the storage tank (say, total number of gallons of water).
A facility capable of generating one gigawatt (GW) could contain one, two, three or even four gigawatt-hours (GWh) of storage. A four gigawatt-hour facility would require storing onsite, four times more batteries than a one gigawatt-hour (GWh) facility even though both might be rated one gigawatt (GW). It would have to have four times as much space to store batteries. And, logic dictates that whatever the failure rate is for a one GWh facility, it is four times higher for a four GWh facility as there are four times as many battery cells that can malfunction. So, the “h” in GWh is very important. There is no safety in numbers when it comes to lithium-ion battery storage facilities; the more batteries there are (as many as 6 million cells in a facility like Seguro), the more chances of fire.
At 1,280 MWh (or 1.28 GWh), Seguro would contain more than 5 times more batteries onsite than the 250 MWh Otay Mesa facility that burned in May 2004.
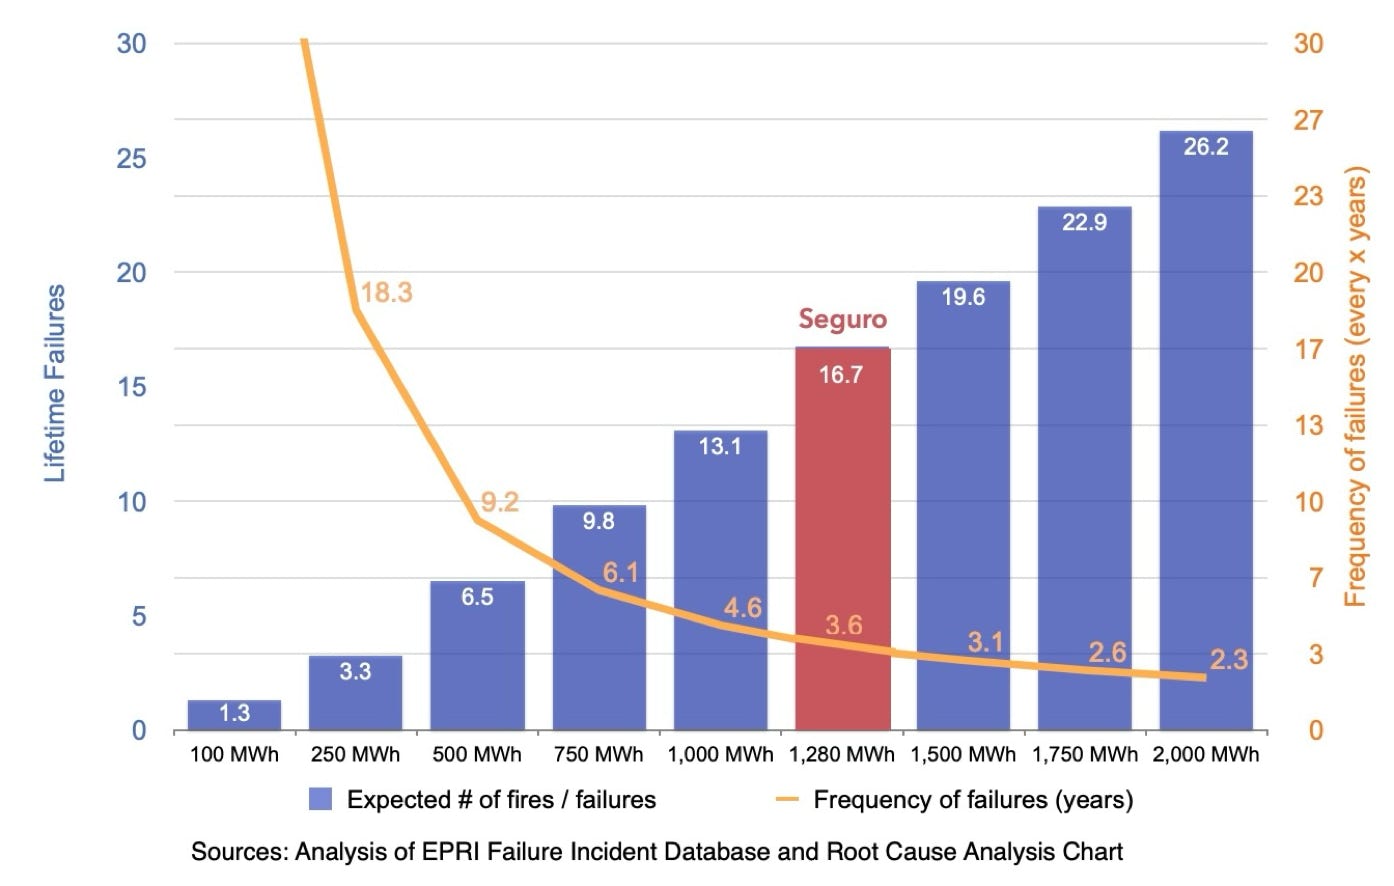
If you use only the (understated) data provided by EPRI in their chart and in their database, you learn something quite interesting and intuitive. The chart provides us very specific numbers for the failure rate per GW (each year), which, when converted to GWh, shows us how many failures one should expect for a facility of any given size in GWh. This conversion yields an average failure rate over the last four years of 0.22 failures per GWh per year which means that for every GWh, there will be a failure about every 5 years. The below chart shows likely number of lifetime failures for different size facilities (blue columns) and average frequency of failures (orange line). The larger the facility (blue columns) the more failures, and the more frequently they are likely to occur (orange line).
The industry uses the EPRI chart to show that failure rates have improved over time, but if you do the simple math, they still pose a substantial risk. For example, a facility like Seguro would have 1,280 MWh (or 1.28 GWh) of batteries onsite. That translates to a 28% chance of having a fire each year or approximately one fire every three and a half years. Over its 60 year site lifespan, it is likely to have about 17 fire incidents. Click here to see the math explained in more detail. This provides another perspective to the data they have provided but provides little consolation to those who would be forced to live next door to such a facility.
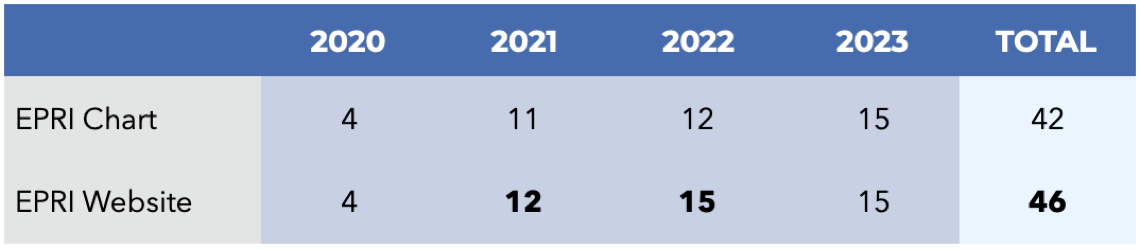
From 2020 to 2024, the EPRI chart shows 42 failures, but the latest updated table shown on their website shows 46 failures, so the total is about 10% lower than the actual data. A corrected chart would show four fires in 2020, twelve in 2021, fifteen in 2022 and fifteen in 2023. Our analysis uses this corrected failure count.
As mentioned above, the reliance on haphazard fire reporting from local media does not pass methodological muster. There isn’t a system in place to track, document and chronicle battery energy storage fires so we have no choice but to rely on the imperfect EPRI database. This data is incomplete, and as a result, understates the failure rate. The projections are therefore a “best case scenario.” The risk is likely higher than what EPRI suggests as well as our own analysis provided here. There are likely more facilities that have caught fire but for any number of reasons, did not receive media coverage. For example fires can happen at remote installations in areas that are not very populated or have no local media. Fires at facilities in foreign countries may get coverage in different languages which are less likely to be picked up in the US. And some countries, like China, are able to control their media to avoid raising doubts about an important export of theirs (they control 40% of the ESS market worldwide). But looking specifically at San Diego County, we know there are three large-scale facilities that are in operation. And, we know there have been three fires in the past four years, which contradicts the narrative that the risk is “extremely low.”
Despite the fact that some facility failures happen during the commissioning process (a time when systems are being installed and tested and systems are more vulnerable), the average time to failure from 2020 to 2023 has been 1.8 years (based on the EPRI database figures). What this means is that, for any given year, the failures that are reported in the EPRI database generally do not reflect failures contributed by facilities that have come online that year (and included in the cumulative gigawatt data in the EPRI graph). For example, the Otay Mesa facility that caught fire in May 2024 was almost four years old. That facility, however, was included in the total GW shown on the EPRI graph for 2021, 2022, and 2023. This lagging effect is another reason why the failure rates shown on the EPRI graph are understated.
Because this industry is so new (the first utility scale facility was commissioned in 2012) and the vast majority of facilities have come online in the past 4 years, we have almost no data on facilities that are 5 or more years old. Aging facilities will have more maintenance issues and more problems related to aging lithium-ion battery cells. Research has shown that lithium-ion batteries become less stable as they age and are more prone to undergo thermal runaway at lower threshold temperatures compared to newer batteries. What will happen when billions of lithium-ion cells approach their end-of-life? Will we see more fire incidents? We don’t know because we haven’t gotten there yet.
The battery energy storage industry is brand new and growing quickly; there is little in the way of land use regulations around the country that might properly mitigate the risk for communities. Counties and cities have been caught off-guard and lack the knowledge, staff expertise (and time) to assess these projects adequately and objectively. The industry has exploited this deficit and aggressively downplayed the risks, minimizing concerns by using jargon and misleading statistics and employing industry-friendly consultants who essentially wield their expertise as a tool to get projects quickly approved without pushback. It’s time for us to stop, take a breath and objectively review the risks involved in these installations. That will enable decisions that are based, not on the profit-motive of an ambitious industry, but on independent facts, stakeholder input and review by all those who will be impacted by these types of projects.
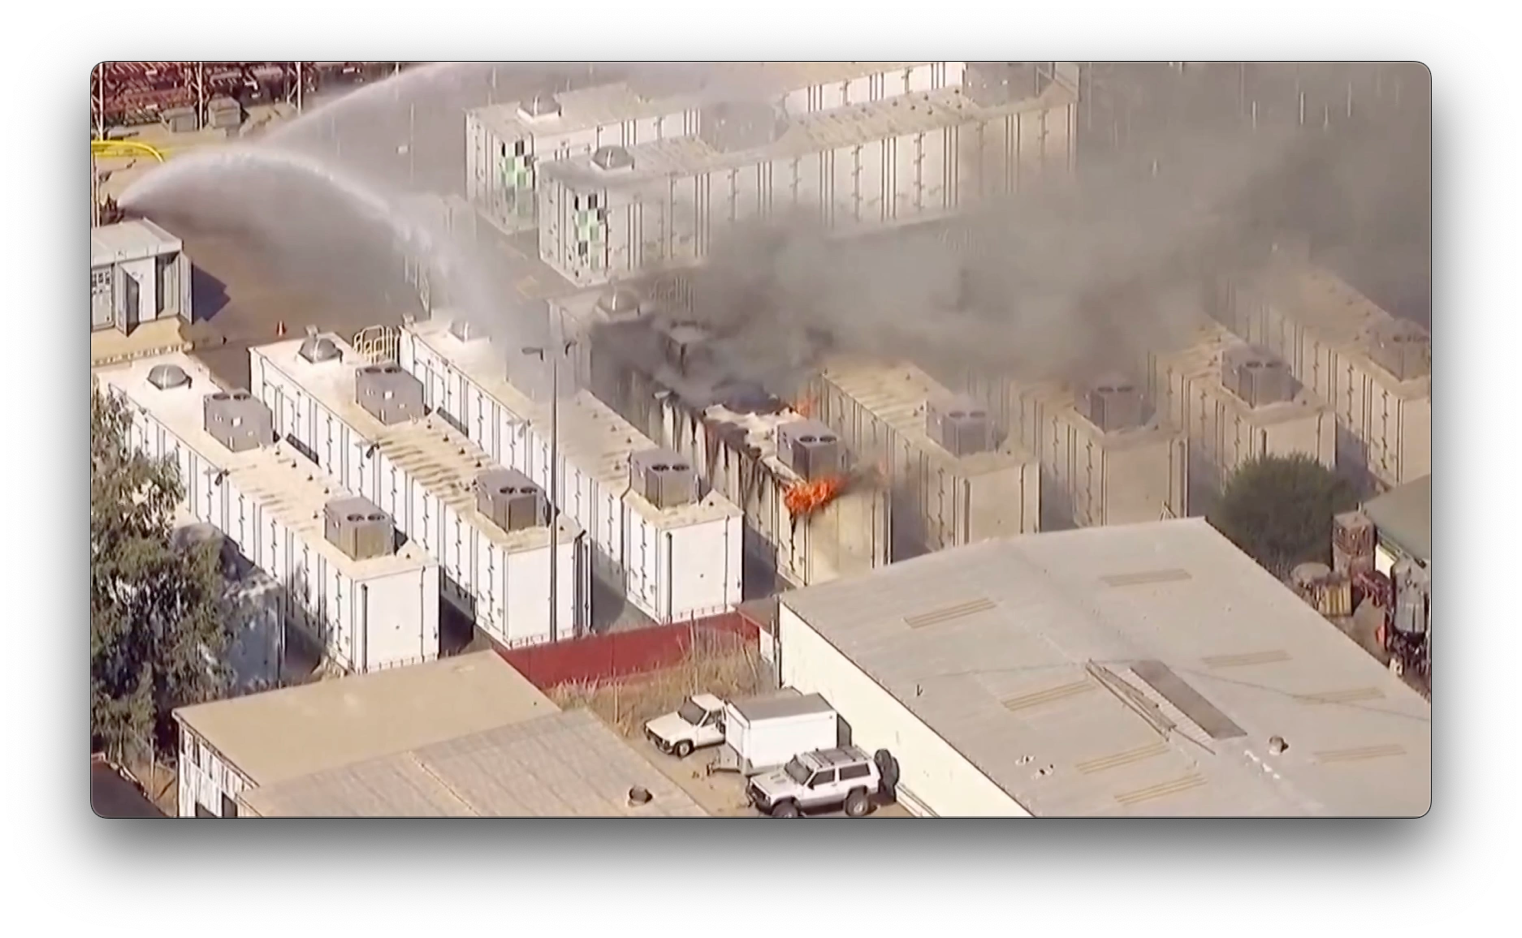
Escondido Battery Storage Fire Sept. 2024. Image: NBC7
Last edited: June 19, 2024
Based on 2.72 hours storage, the weighted average of reported facilities in the EPRI Failure Incident Database table. This assumes that, in terms of storage hours, the facilities in the EPRI table are a representative sample of the overall fleet. It can be reasonably argued that facilities with higher storage hours are overrepresented in the EPRI table, since larger facilities are more likely to incur failures. To the extent this argument holds true, the 2.72 hours storage figure is higher than actual, and the "0.22 Fires/Gigawatt-hour per year" figure is lower than actual (i.e., it understates the fire risk).
The typical "design life" of an energy facility, whether natural gas fueled, solar, wind, or batteries, is 30
years. However, the actual operating life of a facility, or the time span over which a site can be expected
to remain devoted to a given energy industry use, is typically twice the design life or more. Examples in
San Diego County include the Station B Power Plant in downtown San Diego (1921-1983), South Bay
Power Plant in Chula Vista (1960-2010), and Encina Power Plant in Carlsbad (1954-2018). Power
substation and switchyard sites generally can be expected to remain in that land use for 100 years or
more. Irrespective of the design life of individual components, energy industry sites remain active in
their established use as long as it is economical and/or expedient to do so.